

This guide focuses on defining a reproducible indicator and the decision it can support. The worked example follows three units: “results table”, “methodology note” and “findings summary”.
Reference input: research question and authorized data. Expected output: a findings table with methodology. Before assigning work, confirm the current input version and who will review the result.
Connect the metric to a decision
A metric for the original research report publication is useful when it can change the next action. Before building a chart, establish whether you need to stop intake, reassign review or investigate waiting. Define the observation unit: asset, request, file or cycle. Do not combine those units in one percentage. The reference operational record here is a findings table with methodology. The metric should describe what that record can actually establish. When evidence for one stage is missing, identify the gap before interpreting a total that appears to cover the whole process. Measurement starts with a decision and observable records, rather than a dashboard layout.
Write a reproducible definition
The measurement card should retain the name, formula, observation window, source, exclusions and update owner. For a proportion, numerator and denominator must refer to the same population of work. For waiting time, record both ends of the interval and explain how open cases are handled. Do not turn missing observations into zero. Zero means the event was measured and not found; missing means the calculation is not yet supported. This distinction changes decisions, particularly when an item looks punctual simply because its delay was never recorded. Another colleague should be able to reproduce the result from the definition.
Worked example
The illustrative report summarizes authorized responses to one specific question. One table describes the sample and another groups observations. The summary must retain sample limitations and make figures reconstructable without confusing observation with causation.
The example involves Mateo, Leo and Diego. Names, situations and numbers are illustrative and do not represent customer results. The three units let you test the proposed approach before extending it to other work.
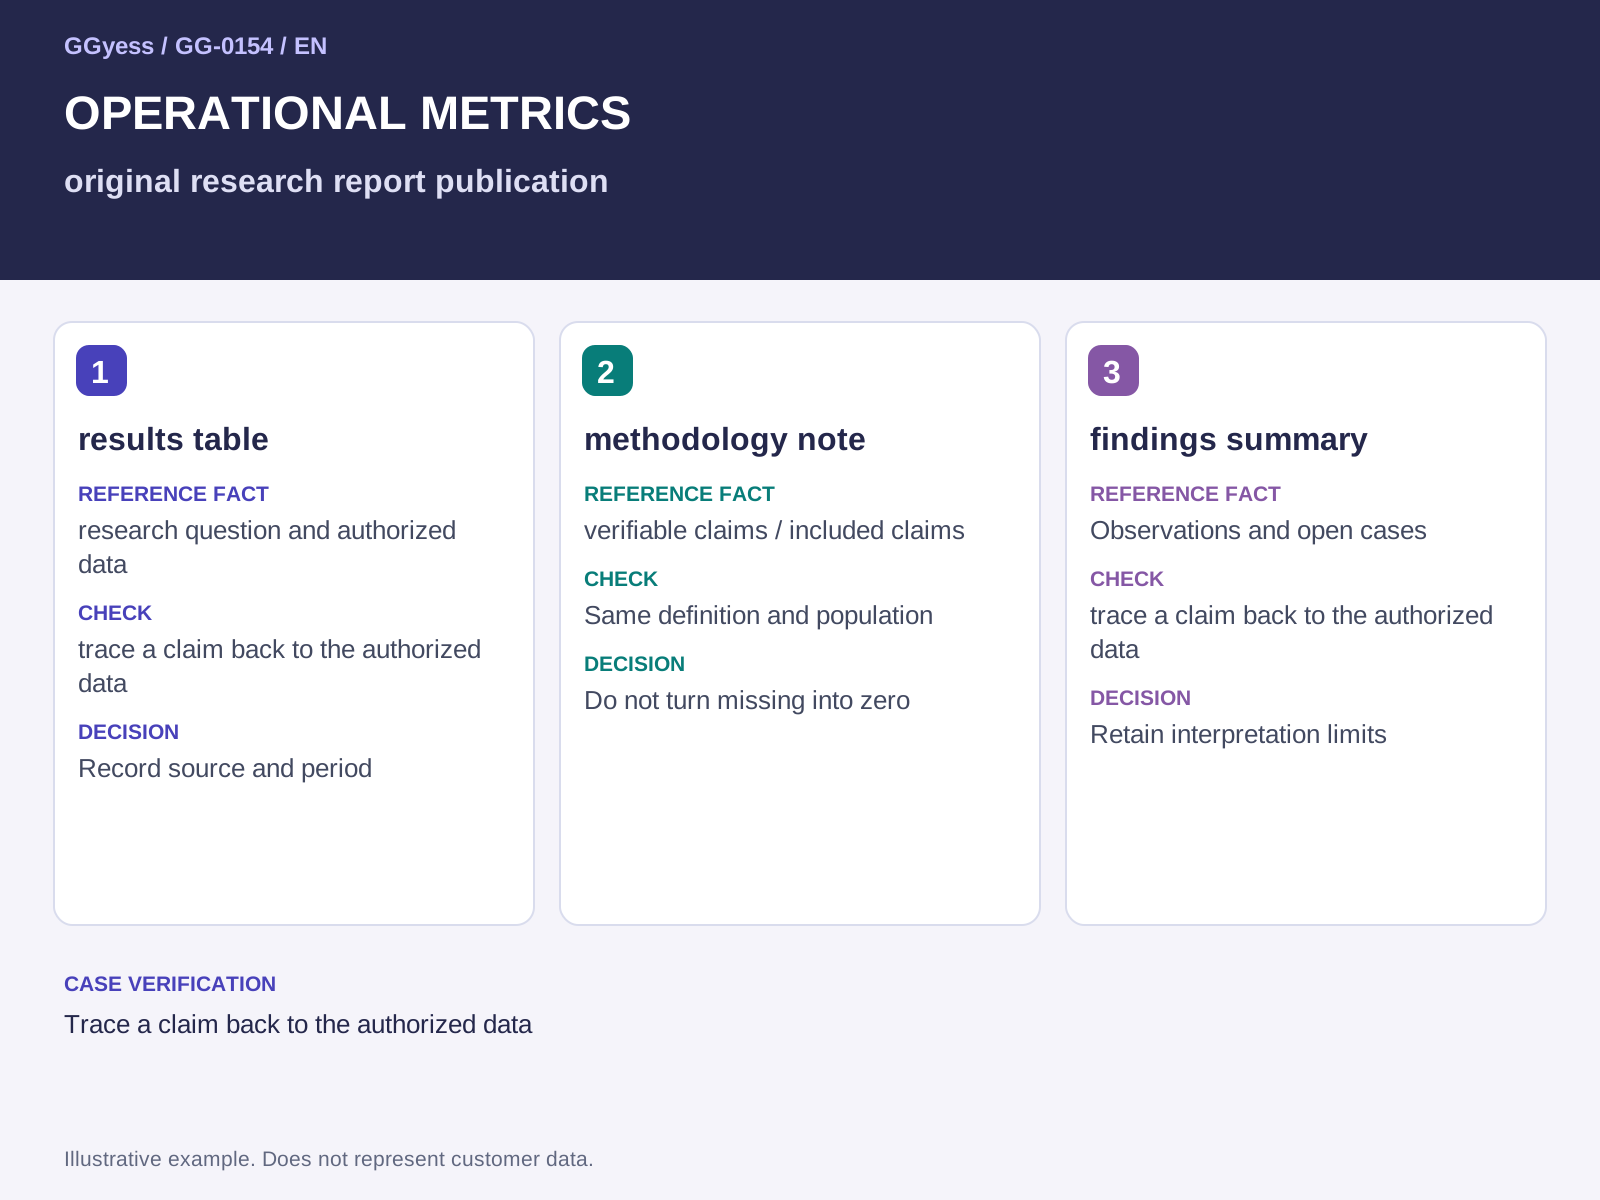
| Unit | Reference fact | Check | Decision |
|---|---|---|---|
| results table | research question and authorized data | trace a claim back to the authorized data | Record source and period |
| methodology note | verifiable claims / included claims | Same definition and population | Do not turn missing into zero |
| findings summary | Observations and open cases | trace a claim back to the authorized data | Retain interpretation limits |
Calculate an example and explain its limits
Proposed indicator: verifiable claims / included claims. Define the unit, period, source and exclusions before calculating it. Retain missing observations as pending and compare periods using the same definition. Arithmetic example separate from the table’s three units: if 8 records meet the numerator condition out of 10, the ratio is 8 / 10 = 80%. This is an illustrative calculation, not a customer measurement or an outcome caused by GGyess.
Review with an action and supporting evidence
For results table, methodology note and findings summary, choose a review point that leaves a real opportunity to intervene. Reviewing a metric after its decision becomes irreversible offers little operational value. Guard against presenting a limited observation as a general conclusion. The proposed check is to trace a claim back to the authorized data. When the indicator changes, inspect its source and the cases behind it before turning a small fluctuation into a success or failure story. Record the decision, action owner and observation expected at the next check. That keeps measurement connected to work instead of allowing the report to become a separate administrative exercise.
What to check before closure
The risk to control in this case is presenting a limited observation as a general conclusion. A completed label needs a supporting observation. Keep the following beside the decision so the receiver can establish what was checked:
- Input and version used: research question and authorized data.
- Case check: trace a claim back to the authorized data.
- Outcome under review: a findings table with methodology.