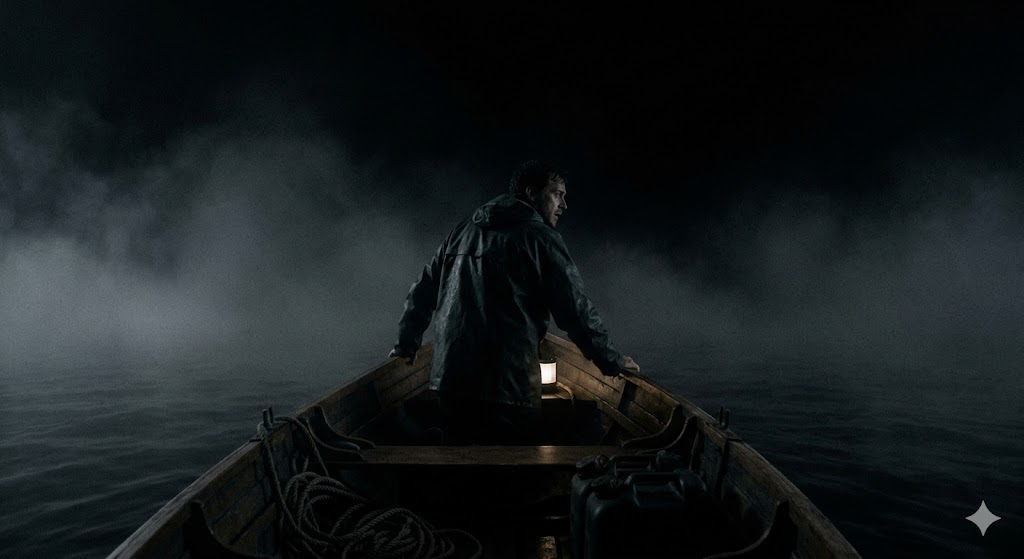
Imagine you’re in the middle of the ocean. It’s night. There’s no moon, no stars, and a dense fog surrounds your small vessel. You have fuel, a powerful engine, and a crew willing to row if needed. But there’s a problem: you have no compass, no GPS, and you can’t see more than two meters ahead of your bow.
How do you feel?
The technical term is “spatial disorientation,” but what you feel in your gut is anxiety. That pressure in your chest isn’t from lack of effort—it’s from lack of vision.
In business, most entrepreneurs and team leaders live in that perpetual fog. They know they need to “reach the harbor” (launch a product, organize an event, close a campaign), but their only navigation tool is a daily to-do list that never seems to end.
They live reactively in the “now,” putting out fires that started yesterday, without realizing that the real fire is forming three kilometers away—in a deadline they still can’t see.
Today, we’re going to clear that fog. We’re going to talk about the tool that separates amateurs from masters of execution: the Gantt Chart—but not from engineering, from neuroscience and performance psychology.
The Brain Is a Spatial Processor, Not a Shopping List
The first mistake we make in project management is believing a to-do list is enough. Lists are useful for grocery shopping—but they’re poison for complex projects. Why? Because the human brain evolved to understand the world in space and time, not in isolated lines of text.
Our ancestors didn’t need a list that said “1. Gather berries, 2. Avoid the tiger.” They needed a mental map: “If I go gather berries in the valley (space), it will take three hours to return (time), and by then the tiger will have left its cave.”
When you turn your projects into a Gantt Chart, you’re doing exactly that: creating a temporal map. You’re allowing your visual cortex—one of the most powerful parts of your brain—to take control. Instead of processing “words,” your brain processes “relationships.”
The Planning Fallacy: The Bias That Makes Us Lie to Ourselves
If you’ve ever said “this will take me two hours” and ended up taking two days—you’re not alone. You’ve fallen victim to the Planning Fallacy.
Neuropsychology shows that humans are chronically optimistic about the future. Our brain “clears the path” of imagined obstacles. We don’t account for that unexpected call, the server crash, or simple mental fatigue.
A Gantt Chart is the antidote to this biological lie. By forcing you to place tasks on a timeline—with clear start and end dates—it confronts you with the physical reality of time. You quickly realize you can’t complete five “critical” tasks on the same Tuesday if each one takes four hours.
It forces operational honesty.
The Butterfly Effect in Your Projects
One of the most powerful concepts in visual management is dependency. In the fog of a task list, you don’t see that “Task A” (designing a logo) is the bottleneck for “Task Z” (printing uniforms).
When tasks are disconnected in your mind, a two-day delay feels minor. But in a Gantt view, you see how that delay shifts the entire timeline—how Monday’s delay collides with Friday’s event.
This is the productivity Butterfly Effect. By visualizing dependencies, you activate a survival instinct. You stop protecting tasks just to “complete them”—you protect them because they support the entire structure.
This creates what we call Visual Purpose: every team member understands that if they slip, the entire map shifts.
Gantt Charts for “Non-Technical” Businesses
There’s a myth that these tools are only for software engineers or construction companies. That couldn’t be further from the truth.
Imagine a marketing agency planning a launch, a law firm preparing a complex case, or even a bakery organizing wedding orders. All benefit from a Work Breakdown Structure (WBS) visualized over time.
For service businesses, a Gantt Chart isn’t complexity—it’s peace of mind. It’s knowing that even if today feels chaotic, the plan is still solid.
It’s the confidence to tell a client: “We can’t start your project until Thursday because we’re in the quality control phase of the previous one—as you can see in our timeline.” That level of transparency builds trust no discount can buy.
Milestones: The Dopamine You Need to Keep Going
A long project is a marathon. The problem with marathons is that the brain gets exhausted if it can’t see the finish line.
If the only reward comes at the end (in three months), motivation collapses halfway through.
That’s where Milestones come in. In project architecture, a milestone is a diamond on the map. It’s not a task—it’s an event: “Contract signed,” “Prototype approved,” “Venue secured.”
Neurochemically, hitting a milestone releases more dopamine than completing a routine task. It validates effort.
By placing milestones in your Gantt Chart, you create emotional checkpoints—giving your team a reason to celebrate every few weeks and maintain momentum.
The “I Wish I Had Known Sooner” Syndrome
Most business failures don’t happen due to lack of talent—but due to lack of synchronization.
When the plan lives in the owner’s head, tasks live in chat messages, and files are buried somewhere else—alignment becomes impossible.
A Gantt Chart acts as the “orchestra score.” It doesn’t matter how talented the violinist or trumpeter is—without a shared score telling them when to play and at what tempo, it’s just noise.
The Gantt is the score that turns your company’s noise into execution.
How to Implement Visual Clarity Without Burning Out
For this to work, the system must follow the law of Cognitive Simplicity. If building the map is harder than the work itself, you’ll abandon it in three days.
You need a system that:
- Is dynamic: If something changes (and it always does), you can drag and drop. The plan must be a living organism—not a stone monument.
- Is collaborative: Everyone sees the same map. A “Single Source of Truth” eliminates “I didn’t know that was due today.”
- Is connected to execution: A beautiful timeline is useless if it’s not linked to files, people, and daily communication.
The Freedom of the Architect
At the end of the day, managing projects with temporal clarity gives you something money can’t buy: real free time.
When you don’t know what’s coming next, you can never truly rest. Your brain keeps scanning the horizon for threats.
But when you have a solid Gantt map—clear milestones, defined dependencies—you can close your laptop and disconnect. You trust that your “future self” has a guide.
You’ve tamed time—turning it from an enemy chasing you into an ally guiding you.
To transform that fog of uncertainty into a highway of results, you need a platform that understands complexity without making you feel it. That platform is GGyess.
GGyess is designed to be the ultimate WorkSuite, where power meets simplicity. Forget unreadable spreadsheets—GGyess’s Gantt View lets you visualize your entire project in a clean, functional timeline. Drag tasks to adjust dates, set dependencies with a click, and define critical Milestones that keep your team aligned and motivated.
But the real magic is that the Gantt doesn’t live in isolation. It’s directly connected to integrated Video Calls for real-time alignment, automated Reminders to keep every milestone on track, and Appointments management to coordinate timelines with external clients.
With GGyess, you stop being lost in the fog—and become the architect of your own success. It’s time to see the future, plan it, and execute it—all from one place.